
By Lou Melone, CFP®, CEPA®
The ever-lingering, unspoken question. It’s the question the average investor has asked—and will keep asking, at least in your mind: Are you worth your fee? In other words, do you truly add value? It may never be said out loud, but don’t believe for a moment it isn’t there every time you meet with your financial advisor. So, understanding this very reasonable concern, how can the advice giver demonstrate real value to the client?
If that advice giver is a CPA, there are tangible ways to show value each year—whether through a refund received, credits applied, or depreciation captured. But in other industries—and especially in this article’s focus, wealth planning—demonstrating value can be more challenging. Why? For a few reasons: first, that value doesn’t appear as a separate line item on a client’s quarterly statement; second, much of it is long-term value delivered during those “return-destroying behavioral events” known as bear markets, when the advisor helps keep the average investor from driving their wealth into the abyss—thanks to Human Nature. As you’ll see in a moment.
Unfortunately, this is not how the average investor tends to see it. Their perspective is usually far more short-term—focused on what you’ve done for the portfolio this year, or maybe even this month. Further complicating the issue is the simple fact that financial advisors cannot guarantee investment performance—nobody can, if they’re honest. Yet investment performance is often the main reason investors believe they hired a financial professional in the first place—a belief falsely fueled by the financial media and market prognosticators.
Now recognizing the reality – Again, Is The Advisor Worth Their Fee?
Research from independent sources say—Yes, they are…but there’s a catch. This doesn’t cover ALL advice providers in the financial industry. You see, according to the research, to add value one must not only offer but perform certain services. And as a certified financial planner (CFP®) for twenty-five of my thirty years in this industry—I’ve witnessed that many do not. So, how can those who are not currently providing the necessary services become the valued advisor required to earn their keep?
As Paul Harvey used to say, “And now, the rest of the story.”
For 13 years, Russell Investments’ Value of an Advisor study has sought to estimate the potential value associated with financial advice. Their research suggests – “advisor value may extend beyond portfolio construction by helping shape the decisions clients make, the risks they may avoid and the outcomes they may achieve through personalized planning, behavioral coaching and tax-aware implementation.”
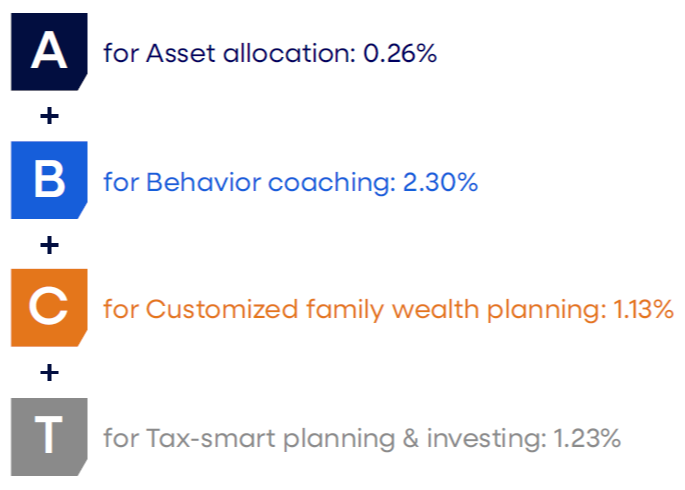
The formula and services analyzed were as follows:
- A- Asset allocation
+
- B- Behavioral coaching
+
- C- Customized family wealth planning
+
- T- Tax-Smart planning and investing
Once the value of the services is added up, they are compared to the average Annual Advisory Fee in the industry—which is typically around one percent per year. The formula created was meant to quantify (as most of what a wealth planner provides is intangible) both the technical and emotional/behavioral contributions provided by an advisor.
Let’s look at the categories and how each adds value:
__________________________________________________________________________________________________________
Asset Allocation: +0.26%
_________________________________________________________________________________________________________
Comfort. Familiarity. These are words that soothe the minds of the average investor. And Human Nature dictates that we do not like change. If we combine these concepts—it’s no surprise that when it comes to building a diversified portfolio, the average investor defaults to what they know. Comparatively—against those portfolios of an investor with an advisor—they can be miles apart. According to the American Association of Individual Investors, a self-directed investor is likely to keep around 20% of a balanced portfolio in cash. In addition, choosing only larger companies when allocating to equities. Below provides a view of how the two compare:
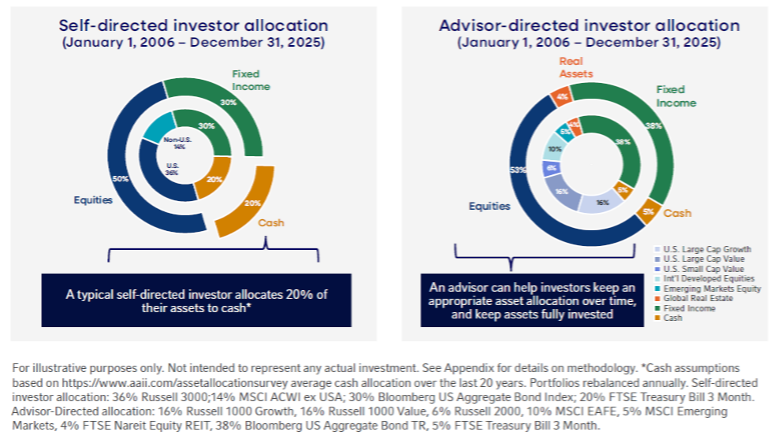
Why is this important?
As we will see later in the Behavioral Coaching section, feeling comfortable and reaching longer-term wealth planning goals can take two different paths. Although a larger portion allocated to cash may provide mental stability (path one), unfortunately it is a drag on the investors’ longer-term returns. The second path—broader diversification—can not only enhance the probability of success longer term but provide a smoother ride along the way.
Below Russell Investments applied actual numbers to the portfolio allocations of Self-Directed and Advisor-Directed, regarding both risk-adjusted returns and dollar growth of those portfolios over a 20-year period.
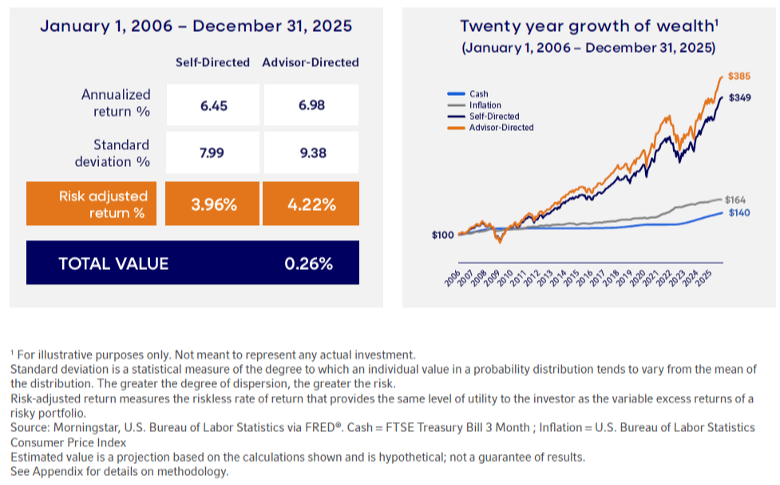
What you will notice is that the Risk-Adjusted Returns of the Advisor-Directed allocation adds 0.26% return per year since 2006. In addition, when viewing the dollar growth, you’ll witness the value of 100 dollars allocated to the four asset classes over time. The highest return provided by the Advisor-Directed asset allocation. This chart also clearly identifies the drag (purchasing power risk) on a portfolio when invested in cash over time.
__________________________________________________________________________________________________________
Behavioral Coaching: +2.30%
__________________________________________________________________________________________________________
The dominant determinate of long-term, real-life returns that real investors receive is
the behavior of the investors themselves.
-Nick Murray
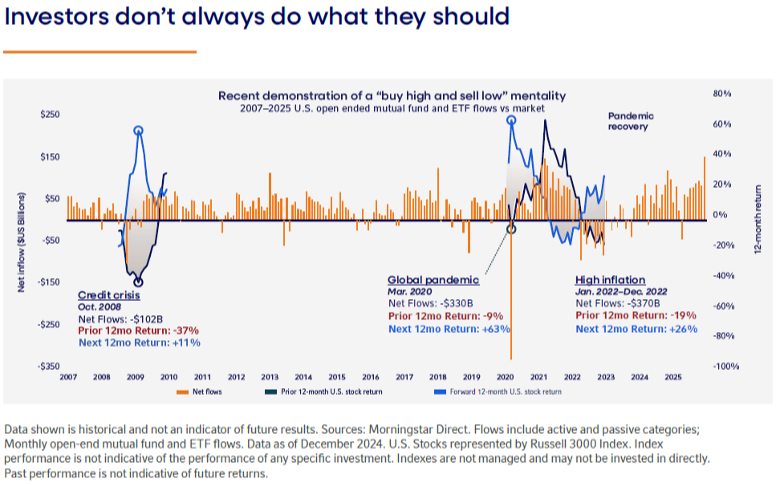
This is the “mother” of all value added. Let’s begin with this simple fact: Human Nature is a failed investor. Our prehistoric brain, evidenced with the rise of Behavioral Science, is hard-wired with cognitive bias and heuristics that lead the average investor to react to market events as a perceived threat (shown below in orange as the monthly net flow of cash into and out of Mutual Funds/ETF’s). This behavior is similar to how cavemen would have reacted to the threat of a Saber-Toothed Tiger at full charge, fangs protruding.
Conversely, according to Russell, “as the chart demonstrates, some investors rely on backward-looking information to make forward looking decisions. Let’s use the March 2020 pandemic outbreak as an example. Investors pulled $330 billion out of the market. They had already felt some pain at that point as they had lost 9% in the prior 12 months. But those investors who left then missed out on the subsequent 12-month return of 63%. Even if they had decided to reinvest at some point they wouldn’t have captured the entire upside.” It provides evidence of how the average investor continued to buy after it had already begun to climb and sell after it began to fall. Simply stated—Bought High and Sold Low. Viewed another way—if the average investor wanted market like returns—all could have been accomplished by doing one seemingly simple task—not reacting to the noise from the financial media. A media that spews end-of-the-world-as-we-know-it daily.
Furthermore, although no longer running from Saber-Toothed Tigers, the stimulus we are running from, financially, elicits the same physiological responses. In other words, when it comes to financial decisions, we tend to act like those knuckle-dragging cave people.
This prehistoric reaction triggers a gap. We call this the investor behavior gap which is shown from the research below by comparing the Average Investor Return vs. the S&P 500 Index from 2011-2025:
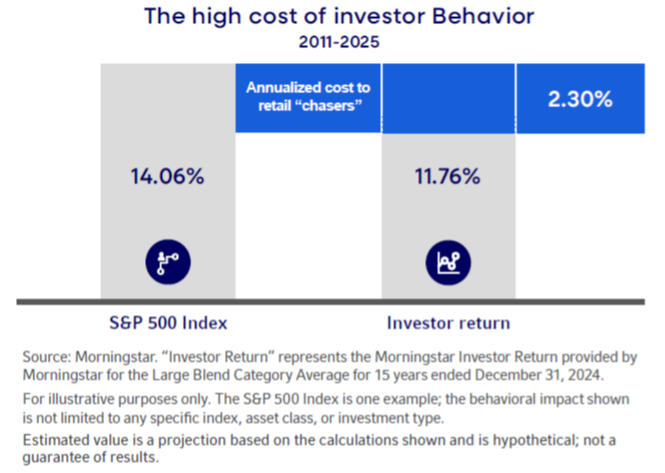
Unfortunately, the average investor consistently behaved themselves out of 2.30% per year in return. All due to Human Nature’s inherent pitfalls.
Behavioral Finance tells us we have over 200 different cognitive biases, the most common return killing bias to investors’ are the following:
- Loss Aversion
- We value gains and losses differently. We feel the pain of loss twice as much as the pleasure of a gain.
- Overconfidence
- A tendency to hold a false and misleading assessment of our skills, intellect, or talent. In short, it's an egotistical belief that we're better than we actually are.
- Herding
- Going with the crowd. Assuming things are good or bad because others are doing the same.
- Mental Accounting
- Although every dollar is the same, we mentally attach a different value on each dollar, based on how it was acquired.
- Familiarity
- The preference of the individuals to remain confined to what is familiar to them. They wish to remain within their comfort zone and do not want to take the path never taken.
__________________________________________________________________________________________________________
Customized Family Wealth Planning: +1.13%
__________________________________________________________________________________________________________
The wealth planning industry is evolving—albeit slowly—and if your financial planner/planner’s firm has not evolved their practice to it, they may not realize it yet but will soon be the way of the Saber-Toothed Tiger.
The foundation of any successful planner/client relationship is a comprehensive financial plan. Let me state this simple, but powerful fact, one more time - it is the foundation. Anything less is smoke-and-mirrors wrapped in a bow of the asset management package (a Robo Advisor). Being a self-proclaimed voice of reality, if this is all the advisor is providing, you may be better off at a Robo Advisor. The “Asset Allocator” may have been sufficient in the years prior to the 1990’s but not anymore.
How can one be certain of the prior statement? There is NO historical evidence for the persistence of performance. None. And if that’s the only service your advisor is providing, you’re most likely getting overcharged.
Let’s examine this a bit further.
What’s the value of the typical ancillary services a financial advisor and his/her team offer compared to a Robo Advisor? Ancillary services provided to clients are the following: addressing tax and estate planning, cash management, trust services, financial planning, wealth education, business succession planning, family relationship management, lifestyle planning, career and giving strategies, insurance needs, and custom requests. These additional services can quickly consume 20, 50, or 100 hours each year. If the advisor/firm offers these ancillary services, Russell Investments estimates that the total planning fee is around 1.50%—as the chart below exhibits.
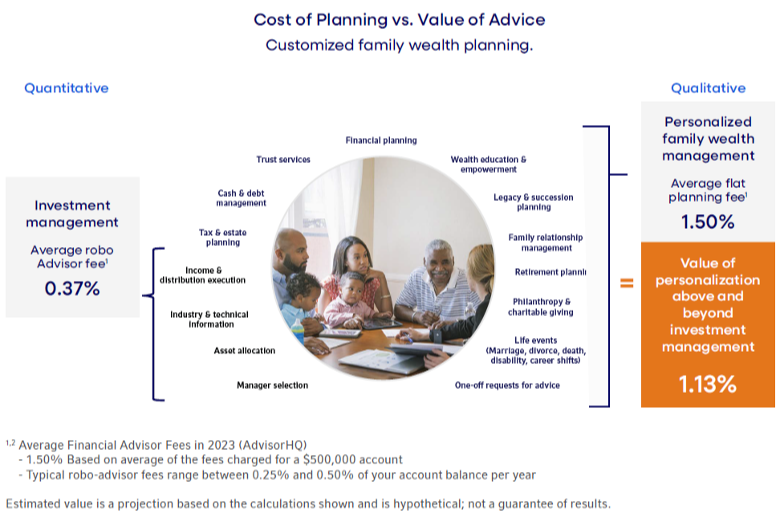
In summary, Russell states, “This means that the work you do to guide your clients through the defining moments of their lives, to ensure their investments align with their goals, to provide expertise on taxes, insurance, careers, and major purchases, to plan their retirement, long-term care needs, and legacy—among a myriad of other services—has value. We believe it can be worth 1.13% more in value over and above the basic asset management that an investor can get from a Robo Advisor.”
__________________________________________________________________________________________________________
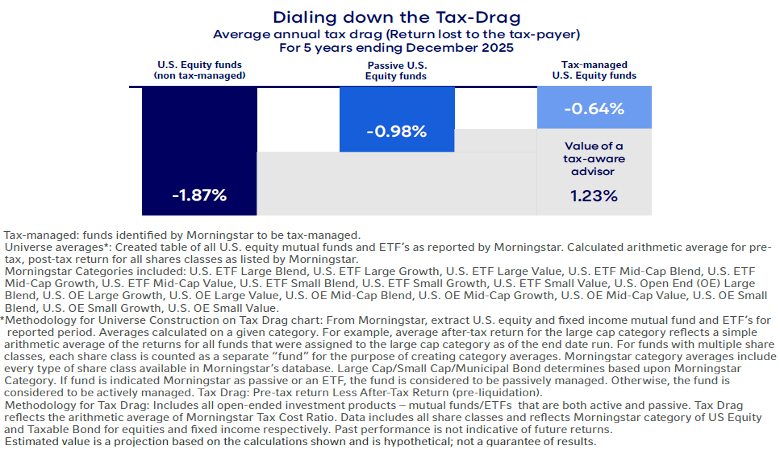
Tax-Smart Planning and Investing: +1.23%
__________________________________________________________________________________________________________
How much of a return can be added with a tax-smart approach? According to Russell Investments, the average annual tax-drag for the five years ending December 31, 2025 was significant. Investors in non-tax managed U.S. equity funds lost on average 1.87% of their return to taxes, Passive US Equity Funds were a drag of 0.98% and those in tax-managed U.S. equity funds forfeited only 0.64%. That’s an added value of 1.23%.
__________________________________________________________________________________________________________
THE BOTTOM LINE: WHAT IS THE VALUE OF A PLANNER?
__________________________________________________________________________________________________________
__________________________________________________________________________________________________________
TOTAL VALUE OF ADVISOR IN 2025
~ 4.92%
__________________________________________________________________________________________________________
The bottom line: based on the Russell study, if the provider of planning advice cannot deliver multiples of the value of their annual fee, the average investor should consider an alternative advisor/firm that provides said comprehensive services. However, according to the study, the advisor can provide said value if he/she adheres to two of the most important factors in each study published; behavioral coaching and a comprehensive planning approach to family wealth management.
Disclosure:
All information has been obtained from sources believed to be reliable, but its accuracy is not guaranteed. There is no representation or warranty as to the current accuracy, reliability or completeness of, nor liability for, decisions based on such information and it should not be relied on as such.
All investments include a risk of loss that clients should be prepared to bear.
The views expressed in this commentary are subject to change based on market and other conditions. These documents may contain certain statements that may be deemed forward‐looking statements. Please note that any such statements are not guarantees of a future performance and actual results or developments may differ materially from those projected. Any projections, market outlooks, or estimates are based upon certain assumptions and should not be construed as indicative of actual events that will occur.
Market data was sourced using Russell Investments April 2026, Advice Study.
Please remember that all investments carry some level of risk, including the potential loss of principal invested. They do not typically grow at an even rate of return and may experience negative growth. As with any type of portfolio structuring, attempting to reduce risk and increase return could, at certain times, unintentionally reduce returns.
Diversification and strategic asset allocation do not assure profit or protect against loss in declining markets.
The Investment Company Institute is the national trade association of U.S. investment companies, which includes mutual funds, closed-end funds, exchange traded funds and unit investment trusts.
Bloomberg Barclays U.S. Aggregate Bond Index: An index, with income reinvested, generally representative of intermediate term government bonds, investment grade corporate debt securities, and mortgagebacked securities (specifically: Barclays Government/Corporate Bond Index, the Asset-Backed Securities Index, and the Mortgage-Backed Securities Index).
FTSE EPRA/NAREIT Developed Index: A global market capitalization weighted index composed of listed real estate securities in the North American, European and Asian real estate markets.
MSCI Emerging Markets Index: A float-adjusted market capitalization index that consists of indices in 21 emerging economies: Brazil, Chile, China, Colombia, Czech Republic, Egypt, Hungary, India, Indonesia, Korea, Malaysia, Mexico, Morocco, Peru, Philippines, Poland, Russia, South Africa, Taiwan, Thailand, and Turkey.
The MSCI EAFE Index is an equity index which captures large- and midcap representation across 21 developed markets countries around the world, excluding the U.S. and Canada. With 918 constituents, the index covers approximately 85% of the free float adjusted market capitalization in each country. Countries include: Australia, Austria, Belgium, Denmark, Finland, France, Germany, Hong Kong, Ireland, Israel, Italy, Japan, the Netherlands, New Zealand, Norway, Portugal, Singapore, Spain, Sweden, Switzerland and the U.K.
The MSCI World ex U.S. Index tracks global stock market performance that includes developed and emerging markets but excludes the U.S.
The Russell 1000® Growth Index measures the performance of the large-cap growth segment of the U.S. equity universe. It includes those Russell 1000 companies with higher price-to-book ratios and higher forecasted growth values.
The Russell 1000® Value Index measures the performance of the large-cap value segment of the U.S. equity universe. It includes those Russell 1000 companies with lower price-to-book ratios and lower expected growth values.
The Russell 2000® Index measures the performance of the small-cap segment of the U.S. equity universe. The Russell 2000 Index is a subset of the Russell 3000® Index representing approximately 10% of the total market capitalization of that index. It includes approximately 2,000 of the smallest securities based on a combination of their market cap and current index membership.
The Russell 3000® Index measures the performance of the largest 3,000 U.S. companies representing approximately 98% of the investable U.S. equity market.
The S&P 500® Index is an index, with dividends reinvested, of 500 issues representative of leading companies in the U.S. large cap securities market.
Indexes are unmanaged and cannot be invested in directly. Returns represent past performance, are not a guarantee of future performance, and are not indicative of any specific investment.
Past performance does not guarantee future performance.
Nothing contained in this material is intended to constitute legal, tax, securities, or investment advice, nor an opinion regarding the appropriateness of any investment, nor a solicitation of any type. The general information contained in this publication should not be acted upon without obtaining specific legal, tax, and investment advice from a licensed professional.
Russell Investments’ ownership is composed of a majority stake held by funds managed by TA Associates Management, LP, with a significant minority stake held by funds managed by Reverence Capital Partners L.P. Certain of Russell Investments’ employees and Hamilton Lane Advisors, LLC also hold minority, noncontrolling, ownership stakes.
Frank Russell Company is the owner of the Russell trademarks contained in this material and all trademark rights related to the Russell trademarks, which the members of the Russell Investments group of companies are permitted to use under license from Frank Russell Company.
The members of the Russell Investments group of companies are not affiliated in any manner with Frank Russell Company russellinvestments.com
FOR MORE INFORMATION:
Call Russell Investments at 800-787-7354 or visit russellinvestments.com. or any entity operating under the “FTSE
RUSSELL” brand.
To view the full study, go to https://russellinvestments.com/us/resources/financial-professionals/value-of-advisor
Melone Private Wealth LLC ("Melone Wealth ") is a registered investment advisor with the U.S. Securities and Exchange Commission. Melone Wealth provides investment advisory and related services for clients nationally.

Financial Planning for Business Owners
Our Business Owner Financial Planning thought leadership has been curated with the intention of explaining the benefits and basics of financial planning.

Business Owner Resources
We provide business owners with resources which may grow their wealth and help them plan for retirement.

Lou Melone, CFP®, CEPA®
Lou helps clients answer two questions:
1) Do you know exactly how much money it is going to take for you to retire comfortably
2) to remain comfortably retired?